RealEstateRama   -   Site   -   in News   -   in Media   -   in Social   -   Web

HUD REPORTS “WORST CASE HOUSING NEEDS” INCREASED IN 2015

WASHINGTON – (RealEstateRama) — The number of very poor unsubsidized families struggling to pay their monthly rent and who may also be living in substandard housing increased between 2013 and 2015, according to a new report released today by the U.S. Department of Housing and Urban Development.  HUD reports that in 2015, 8.3 million very low-income unassisted families paid more than half their monthly income for rent, lived in severely substandard housing, or both.  Read HUD’s latest estimate of Worst Case Housing Needs.

“Two years ago, our nation was still feeling the aftershocks of our housing recession with rents growing faster than many families’ incomes,” said HUD Secretary Ben Carson.  “After years of trying to keep up with rising rents, it’s time we take a more holistic look at how government at every level, working with the private market and others, can ease the pressure being felt by too many un-assisted renters.  Today’s affordable rental housing crisis requires that we take a more business-like approach on how the public sector can reduce the regulatory barriers so the private markets can produce more housing for more families.”

Demand for affordable housing is growing faster than the construction of homes working families can afford to rent, especially in high-cost areas of the country. The Trump Administration is seeking to stimulate the production and preservation of affordable housing in a number of ways.  By pursuing housing finance reform, the Administration seeks to unwind the Federal government’s role in the private mortgage market and ease the stress on rental markets.

Worst Case Housing Needs are defined as renters with very low incomes (below half the median in their area) who do not receive government housing assistance and who either paid more than half their monthly incomes for rent, lived in severely substandard conditions, or both. HUD’s report finds that housing needs cut across all regions of the country and include all racial and ethnic groups, regardless of whether they live in cities, suburbs or rural areas. In addition, HUD concluded that large numbers of worst case needs were also found across various household types including families with children, senior citizens, and persons with disabilities.

HUD’s estimate is part of a long-term series of reports measuring the scale of critical housing problems facing very low-income un-assisted renters. Based on data from the 2015 American Housing Survey conducted by the U.S. Census Bureau, the number of these “Worst Case Housing Needs” increased from 2013 yet remain lower than the nearly 8.5 million households reported in 2011.  For the first time, HUD is reporting estimates of Worst Case Housing Needs for select metropolitan areas across the country (see below).
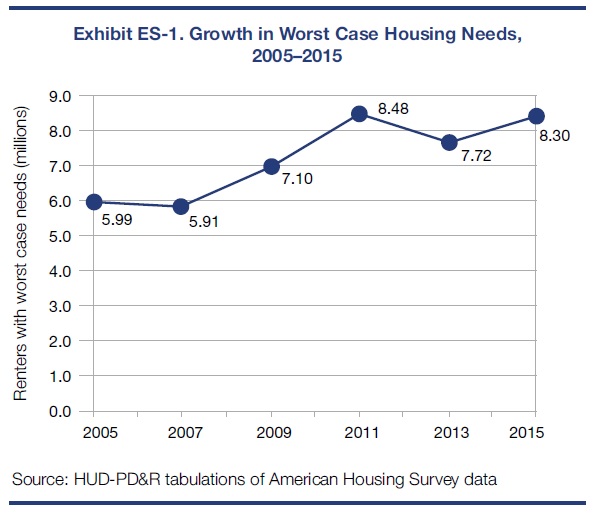
Exhibit-ES-1

HUD’s report found:

  • After a decline in Worst Case Needs from 2011 to 2013, the number of these very poor unsubsidized renter households increased between 2013 and 2015 to the second highest number of households recorded – 8.3 million.
  • The number of households with worst case needs have increased by 66 percent since 2001, with historic increases occurring between 2007 and 2011 when the combination of mortgage foreclosures, widespread unemployment, and shrinking renter incomes dramatically expanded severe housing problems.
  • While incomes continued to rise between 2013 and 2015, rents also increased nearly as fast. For the poorest renters, however, growth in rental costs outpaced income gains.
  • Though the production of rental housing is strong, the rapidly growing renter population is putting increasing pressure on the rental market, particularly on the inventory of affordable rental housing.
  • The number of households with worst case needs increased across all racial and ethnic groups. The prevalence of worst case needs during 2015 was 47 percent for Hispanic renters, 45 percent for non-Hispanic White renters, 37 percent for non-Hispanic Black renters, and 41 percent for others.
  • Regionally, the South and West were home to most very low-income renters. These renters also had the highest prevalence of worst case needs and the lowest likelihood of receiving housing assistance. By metropolitan type, worst case needs were most prevalent in densely populated urban suburbs, followed by central cities.

Worst Case Needs at the Local Level

For the first time, HUD is reporting estimates of Worst Case Housing Needs for select metropolitan areas across the country.  For the largest 15 metropolitan areas, HUD will measure these needs every two years*.  The remaining 10 metropolitan areas represent a subset of the 16th to 50th largest metropolitan areas that will be surveyed on a rotating basis every 4 years++.


2015 Worst Case Needs by Metropolitan Area


Atlanta* # Very Low-Income Renter Households (thousands)

259

# Worst Case Households (thousands)

127

% of Worst Case Housing Needs

49

Boston* # Very Low-Income Renter Households (thousands)

300

# Worst Case Households (thousands)

93

% of Worst Case Housing Needs

31

Chicago* # Very Low-Income Renter Households (thousands)

567

# Worst Case Households (thousands)

242

% of Worst Case Housing Needs

43

Cincinnati++ # Very Low-Income Renter Households (thousands)

127

# Worst Case Households (thousands)

47

% of Worst Case Housing Needs

37

Cleveland++ # Very Low-Income Renter Households (thousands)

159

# Worst Case Households (thousands)

62

% of Worst Case Housing Needs

39

Dallas-Ft. Worth* # Very Low-Income Renter Households (thousands)

365

# Worst Case Households (thousands)

177

% of Worst Case Housing Needs

49

Denver++ # Very Low-Income Renter Households (thousands)

140

# Worst Case Households (thousands)

60

% of Worst Case Housing Needs

43

Detroit* # Very Low-Income Renter Households (thousands)

251

# Worst Case Households (thousands)

115

% of Worst Case Housing Needs

46

Houston* # Very Low-Income Renter Households (thousands)

347

# Worst Case Households (thousands)

159

% of Worst Case Housing Needs

46

Kansas City++ # Very Low-Income Renter Households (thousands)

121

# Worst Case Households (thousands)

41

% of Worst Case Housing Needs

34

Los Angeles* # Very Low-Income Renter Households (thousands)

1,041

# Worst Case Households (thousands)

567

% of Worst Case Housing Needs

55

Memphis++ # Very Low-Income Renter Households (thousands)

90

# Worst Case Households (thousands)

44

% of Worst Case Housing Needs

49

Miami-Ft. Lauderdale* # Very Low-Income Renter Households (thousands)

373

# Worst Case Households (thousands)

227

% of Worst Case Housing Needs

61

Milwaukee++ # Very Low-Income Renter Households (thousands)

115

# Worst Case Households (thousands)

50

% of Worst Case Housing Needs

44

New Orleans++ # Very Low-Income Renter Households (thousands)

76

# Worst Case Households (thousands)

31

% of Worst Case Housing Needs

41

New York City* # Very Low-Income Renter Households (thousands)

1,834

# Worst Case Households (thousands)

815

% of Worst Case Housing Needs

44

Philadelphia* # Very Low-Income Renter Households (thousands)

342

# Worst Case Households (thousands)

145

% of Worst Case Housing Needs

42

Phoenix* # Very Low-Income Renter Households (thousands)

227

# Worst Case Households (thousands)

124

% of Worst Case Housing Needs

55

Pittsburgh++ # Very Low-Income Renter Households (thousands)

141

# Worst Case Households (thousands)

43

% of Worst Case Housing Needs

31

Portland, OR/Vancouver, WA++ # Very Low-Income Renter Households (thousands)

125

# Worst Case Households (thousands)

56

% of Worst Case Housing Needs

45

Raleigh, NC++ # Very Low-Income Renter Households (thousands)

63

# Worst Case Households (thousands)

25

% of Worst Case Housing Needs

40

Riverside, CA* # Very Low-Income Renter Households (thousands)

215

# Worst Case Households (thousands)

123

% of Worst Case Housing Needs

57

San Francisco-Oakland* # Very Low-Income Renter Households (thousands)

287

# Worst Case Households (thousands)

142

% of Worst Case Housing Needs

50

Seattle-Tacoma, WA* # Very Low-Income Renter Households (thousands)

199

# Worst Case Households (thousands)

83

% of Worst Case Housing Needs

42

Washington, DC-VA-MD-WV* # Very Low-Income Renter Households (thousands)

343

# Worst Case Households (thousands)

141

% of Worst Case Housing Needs

41

###

HUD’s mission is to create strong, sustainable, inclusive communities and quality affordable homes for all.
More information about HUD and its programs is available on the Internet
at www.hud.gov and http://espanol.hud.gov.

You can also connect with HUD on social media and follow Secretary Carson on Twitter and Facebook or sign up for news alerts on HUD’s Email List.

Brian Sullivan
(202) 708-0685
http://www.hud.gov/news/index.cfm