Housing has definitely increased over the years and a new analysis conducted by online deed preparation company Deedclaim dove into how much each state has grown.
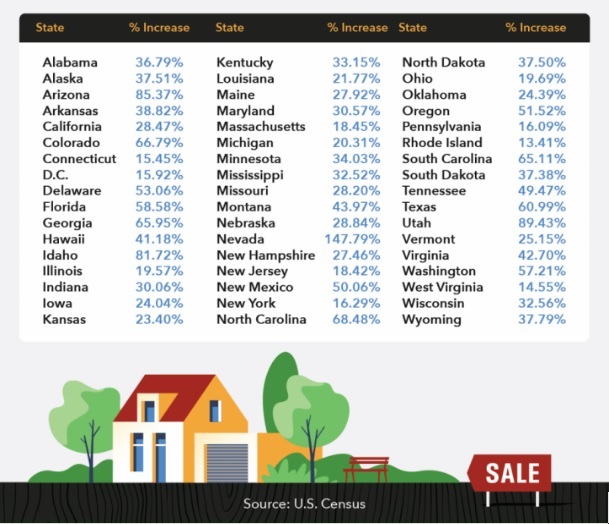
1990-2019
Looking at the country overall, there was a 36.59% increase in available housing between 1990-2019. The current availability of housing across the nation is 2.35 units per capita. States that saw some of the highest increases during this near-30 year period include Nevada, Utah, and Arizona. On the other hand, states such as Rhode Island and West Virginia saw the least amount of growth.

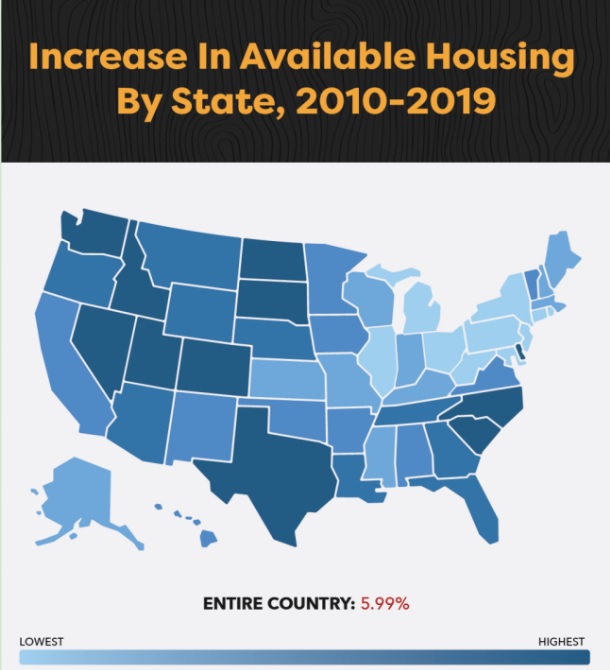
2010-2019
Just between the last two decades, the U.S. saw a housing increase of right under 6% (5.99). Between this time, you can see a shift in which states have shown the most growth. Utah is still a key player in this time frame, but North Dakota saw a huge jump in housing, with a 19% increase, and Texas saw an over 12% increase.

For more on this analysis and to see each state’s year-by-year growth, click here.


