

WASHINGTON – (RealEstateRama) — The U.S. Department of Housing and Urban Development (HUD) and the U.S. Census Bureau jointly announced the following new residential construction statistics for July 2017.
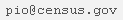
Building Permits: Privately owned housing units authorized by building permits in July were at a seasonally adjusted annual rate of 1,223,000. This is 4.1 percent (±0.9 percent) below the revised June rate of 1,275,000 and is 4.1 percent (±1.8 percent) above the July 2016 rate of 1,175,000. Single-family authorizations in July were at a rate of 811,000; this is unchanged from the revised June figure of 811,000. Authorizations of units in buildings with five units or more were at a rate of 377,000 in July.
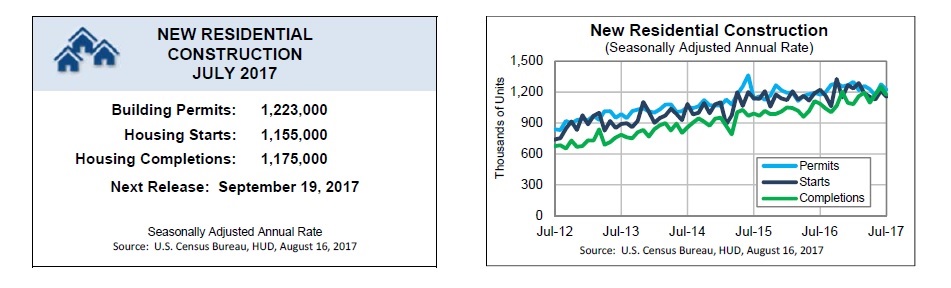
Housing Starts: Privately owned housing starts in July were at a seasonally adjusted annual rate of 1,155,000. This is 4.8 percent (±10.2 percent)* below the revised June estimate of 1,213,000 and is 5.6 percent (±8.5 percent)* below the July 2016 rate of 1,223,000. Single-family housing starts in July were at a rate of 856,000; this is 0.5 percent (±8.5 percent)* below the revised June figure of 860,000. The July rate for units in buildings with five units or more was 287,000.
Housing Completions: Privately owned housing completions in July were at a seasonally adjusted annual rate of 1,175,000. This is 6.2 percent (±14.3 percent)* below the revised June estimate of 1,252,000 and is 8.2 percent (±12.6 percent)* above the July 2016 rate of 1,086,000. Single-family housing completions in July were at a rate of 814,000; this is 1.6 percent (±11.9 percent)* below the revised June rate of 827,000. The July rate for units in buildings with five units or more was 354,000.
The August report is scheduled for release on September 19, 2017.
Read more about today’s release of housing construction activity.
EXPLANATORY NOTES
In interpreting changes in the statistics in this release, note that month-to-month changes in seasonally adjusted statistics often show movements which may be irregular. It may take three months to establish an underlying trend for building permit authorizations, six months for total starts, and six months for total completions. The statistics in this release are estimated from sample surveys and are subject to sampling variability as well as nonsampling error including bias and variance from response, nonreporting, and undercoverage. Estimated relative standard errors of the most recent data are shown in the tables. Whenever a statement such as “2.5 percent (±3.2 percent) above” appears in the text, this indicates the range (-0.7 to +5.7 percent) in which the actual percentage change is likely to have occurred. All ranges given for percentage changes are 90 percent confidence intervals and account only for sampling variability. If a range does not contain zero, the change is statistically significant. If it does contain zero, the change is not statistically significant; that is, it is uncertain whether there was an increase or decrease. The same policies apply to the confidence intervals for percentage changes shown in the tables. On average, the preliminary seasonally adjusted estimates of total building permits, housing starts and housing completions are revised 3 percent or less. Explanations of confidence intervals and sampling variability can be found at the Census Bureau’s website.
* The 90 percent confidence interval includes zero. In such cases, there is insufficient statistical evidence to conclude that the actual change is different from zero.
###
U.S. Dept. of Housing and Urban Development
Office of Public Affairs
(202) 708-0685
August 16, 2017

U.S. Census Bureau
Raemeka Mayo or Stephen Cooper
Economic Indicators Division
(301) 763-5160
")


